What is the local picture?
Some data is given by Clinical Commissioning Group (CCG). Suffolk is covered by three :
- West Suffolk
- Ipswich and East Suffolk
- Norfolk and Waveney, which includes the whole of the county of Norfolk, as well as parts of north-east Suffolk (Lowestoft and areas south to Southwold and Halesworth).
The true number of people with dementia in Suffolk is unknown, as some people have not been formally diagnosed.
In Suffolk in 2019/2020 (Figure 1):
- 7,836 people of all ages and registered with a GP were recorded as having dementia: 1.0% of the population, significantly higher than England (0.8%).
- 7,200 people aged 65 and over were recorded as having dementia: 3.84%, significantly lower than England (3.97%).
- 176 people aged under 65 were recorded as having dementia: 2.4% of people with dementia, significantly lower than England (3.05%)
- The crude recorded prevalence of dementia in people aged under 65 in 2020 was 176 (2.85 per 100,000), similar to England as a whole (3.05 per 100,000). (Public Health England Dementia Profile)

Source: Public Health England Fingertips Dementia Profile
As shown in Figure 1, the rate of new diagnoses (incidence) in Suffolk in 2018/19 (11.9 per thousand, n=2,173) was similar to England (11.4).
The number of people registered with a GP recorded as having dementia (QOF prevalence) is increasing. This could reflect ongoing work to improve diagnosis of dementia in primary care.
Projected prevalence of dementia in Suffolk
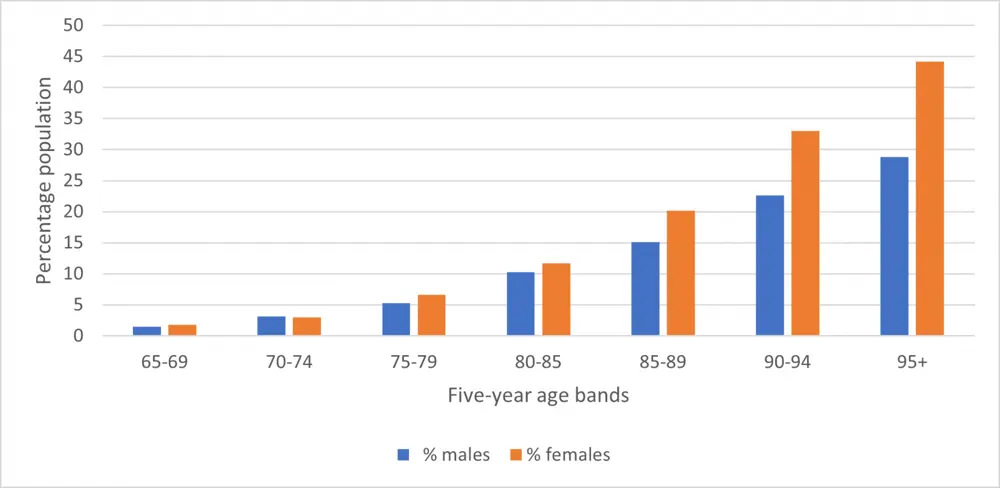
This estimate is published through POPPI, and calculated by applying national prevalence estimates from the Alzheimer's Society Dementia UK Report to Office of National Statistics population projections. The number of individuals with dementia increases with age. A higher percentage of women aged 75 and over have dementia than men (Figure 2). Prevalence estimates are particularly high among those aged 90 and over.
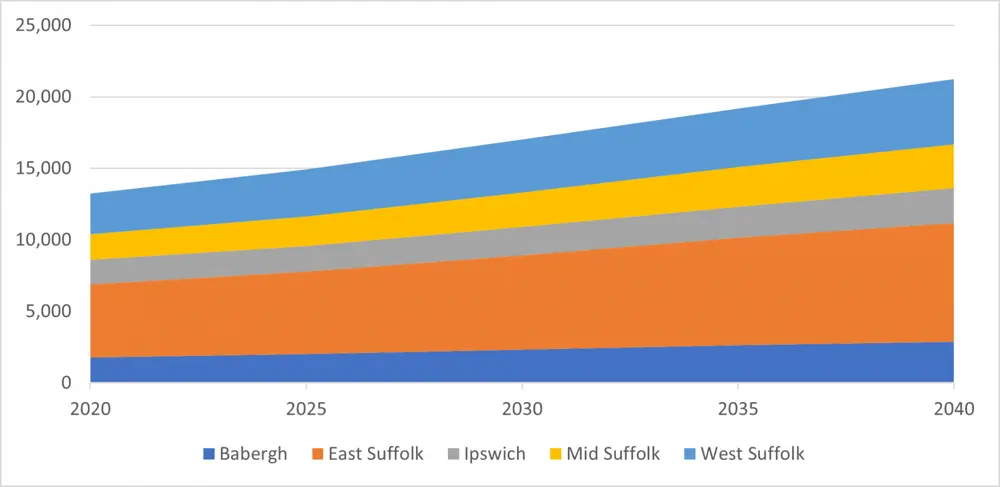
In 2020 there were around 13,000 people with dementia living in Suffolk. It is estimated that by 2040 there will be around 21,000 individuals living with dementia in Suffolk, most living in East Suffolk. The increase is driven by the ageing population (Figure 3).
Gap between expected and actual dementia diagnoses
Not everyone with dementia has a formal diagnosis. The difference between the number of people thought to have dementia and the number of people diagnosed with dementia is known as the “dementia gap”. The nationally set target is for at least two-thirds (66.7%) of people with dementia to be diagnosed.
The estimated number of people with dementia varies by district, based on the age and gender of the population (Figure 4, table 1). The highest estimated number of individuals with dementia live in East Suffolk (4,428). It is estimated that 5,090 individuals living in Suffolk have undiagnosed dementia.
Dementia diagnosis rates are calculated by comparing the number of GP-registered patients with a diagnosis of dementia and the number of people expected to have dementia. In May 2021, the dementia diagnosis rate among people aged 65 and over in Suffolk was 58.4%, significantly below the national target. Ipswich had the highest dementia diagnosis rate (64.6%), in line with the national target; diagnosis rates were significantly lower than the national target in the other four Suffolk lower tier local authorities. Mid Suffolk had the lowest rate (53.9%) (Figure 4, Table 1).
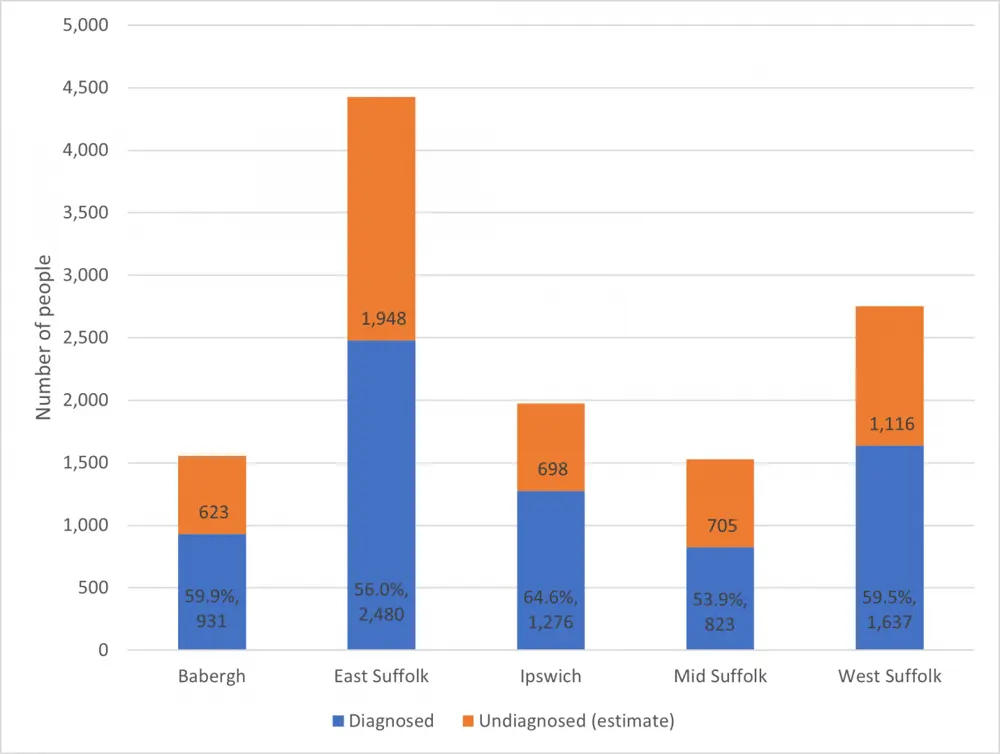
Table 1: Number of individuals aged 65 and over diagnosed with dementia, number estimated to be undiagnosed and diagnosis rate, lower tier local authorities, Suffolk, May 2021
| Lower-tier local authority | Diagnosis rate (%) |
individuals aged 65 and over diagnosed with dementia |
Estimated to be undiagnosed |
|---|---|---|---|
| Babergh | 59.9% | 931 | 623 |
| East Suffolk | 56.0% | 2,480 | 1,948 |
| Ipswich | 64.6% | 1,276 | 698 |
| Mid Suffolk | 53.9% | 823 | 705 |
| West Suffolk | 59.5% | 1,637 | 1,116 |
Hospital admissions
At any one time, 1 in 4 hospital beds are occupied by people living with dementia. People with dementia often experience longer hospital stays, delays in leaving hospital and reduced independent living. Hospital admission can trigger distress, contributing to a decline in functioning and a reduced ability to return home to independent living.
The direct standardised hospital admission rates enable comparisons between areas of the number of people admitted to hospital with dementia, whether or not that's the primary reason for admission - most people with dementia are admitted to hospital for another, physical health, reason.
In the tables below, dementia has been separated into Alzheimer’s disease, vascular and unspecified dementia.
No CCG had admission rates significantly higher than the England rates. The direct standardised rates of inpatient admissions for vascular dementia were significantly lower than England for all CCGs covering Suffolk (Table 2). The direct standardised rates of inpatient admissions for unspecified dementia were significantly lower than England for Norfolk and Waveney CCG. West Suffolk CCG and Norfolk and Waveney CCG also had direct standardised inpatient admissions for patients with Alzheimer’s disease that were significantly lower than England. Norfolk and Waveney CCG had a significantly lower direct standardised inpatient admissions for patients with unspecified dementia than England.
Table 2: Direct standardised rate of inpatient admissions (aged 65 years and over) by type of dementia recorded and responsible CCG (2019/20), rates per 100,000
|
Area |
Alzheimer's disease rate |
Vascular dementia rate |
Unspecified dementia rate |
|---|---|---|---|
| NHS Ipswich & East Suffolk CCG | 745 | 464 | 1,219 |
| NHS West Suffolk CCG | 525 | 459 | 1,142 |
| NHS Norfolk & Waveney CCG | 592 | 394 | 997 |
| England | 762 | 523 | 1,182 |
Note: Figures in bold are significantly lower than England (described in text)
Source: Public Health England Fingertips Dementia Profile
A hospital admission can cause distress and confusion to someone who has dementia, which sometimes means they cannot go back to live in their own home, as their care needs are too great. NICE (the National Institute for Clinical Excellence) recommends work to reduce hospital admissions for people with dementia, for example, higher than expected numbers of short stays in hospital for people with dementia may suggest that community care and dementia services should be reviewed.
National trends in hospital admissions for people with dementia have been increasing, but the three CCGs that cover Suffolk have rates similar to, or better than, England (Table 3).
Table 3: Dementia emergency admissions (and percentage that are short stay), people aged 65 and over, by Suffolk CCG of responsibility, 2019/20
| Indicator | England | NHS Ipswich & East Suffolk CCG | NHS Norfolk & Waveney CCG | NHS West Suffolk CCG |
|---|---|---|---|---|
| Direct standardised rate of emergency admissions | 3,517 | 3,419 | 2,657 | 3,096 |
| Percentage short stay (one night or less) | 31.4% | 27.7% | 25.3% | 32.6% |
Note: Figures in bold are significantly lower than England
Mortality
The age-standardised mortality rate (ASMR) for deaths registered due to dementia and Alzheimer's disease has been increasing in Suffolk and in England since 2013. It is the only “top five” underlying cause in Suffolk – and in England – where the ASMR has increased since 2013.
The rate has decreased for the other four main causes: cancer (malignant neoplasms), cerebrovascular diseases, chronic lower respiratory diseases, ischaemic heart diseases. The ASMR for dementia and Alzheimer diseases (sic) was 108.4 in Suffolk in 2020, and 120.5 in England.
Possible reasons for the increase include:
- dementia and Alzheimer's disease are more likely to occur at older ages: as more people live longer and survive other illnesses there will be more deaths related to ageing,
- there is a better understanding of dementia, and improved diagnosis,
- the coding framework for cause of death was updated in 2011 and 2014 increasing the number of deaths with an underlying cause of dementia.
In 2019, the direct standardised mortality rate from dementia in people aged 65 and over was significantly better in Suffolk (796 per 100,000) than England as a whole (849 per 100,000) (Figure 5). The rate was also significantly better in Ipswich and East Suffolk CCG (779 per 100,000, Table 4). The rates for the two other CCGs that cover Suffolk (West Suffolk and Norfolk and Waveney) were not significantly different from the England rate (Table 4).(Source: Public Health England Fingertips Dementia Profile)
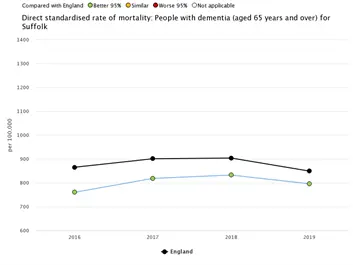
Table 4: Direct standardised rate of mortality: People with dementia (aged 65 years and over), Suffolk CCGs and England, 2019 - 2019
| Indicator | 2016 | 2017 | 2018 | 2019 |
|---|---|---|---|---|
| NHS Ipswich And East Suffolk CCG | 721 | 806 | 837 | 779 |
| NHS West Suffolk CCG | 828 | 832 | 771 | 832 |
| NHS Norfolk & Waveney CCG | not available | 886 | 907 | 834 |
| England | 866 | 901 | 904 | 849 |
Note: Figures in bold are significantly lower than England